Yellowstone National Park is a natural wonder that attracts millions of visitors each year, drawn to its stunning landscapes, diverse wildlife, and unique geological features. Understanding the park’s climate is crucial for both visitors and researchers, as it shapes the ecosystem and influences the timing of various natural events. In this blog post, we’ll delve into the historical and projected trends of temperature change, as well as the average annual precipitation patterns in Yellowstone National Park.
Temperature Trends in Yellowstone National Park
Historical Trend
Over the past century, Yellowstone National Park has experienced a warming trend, with average temperatures increasing by approximately 2°F (1.1°C) since 1900. This gradual rise in temperature has had a significant impact on the park’s ecosystems, affecting the distribution and behavior of various plant and animal species.
Projected Trend
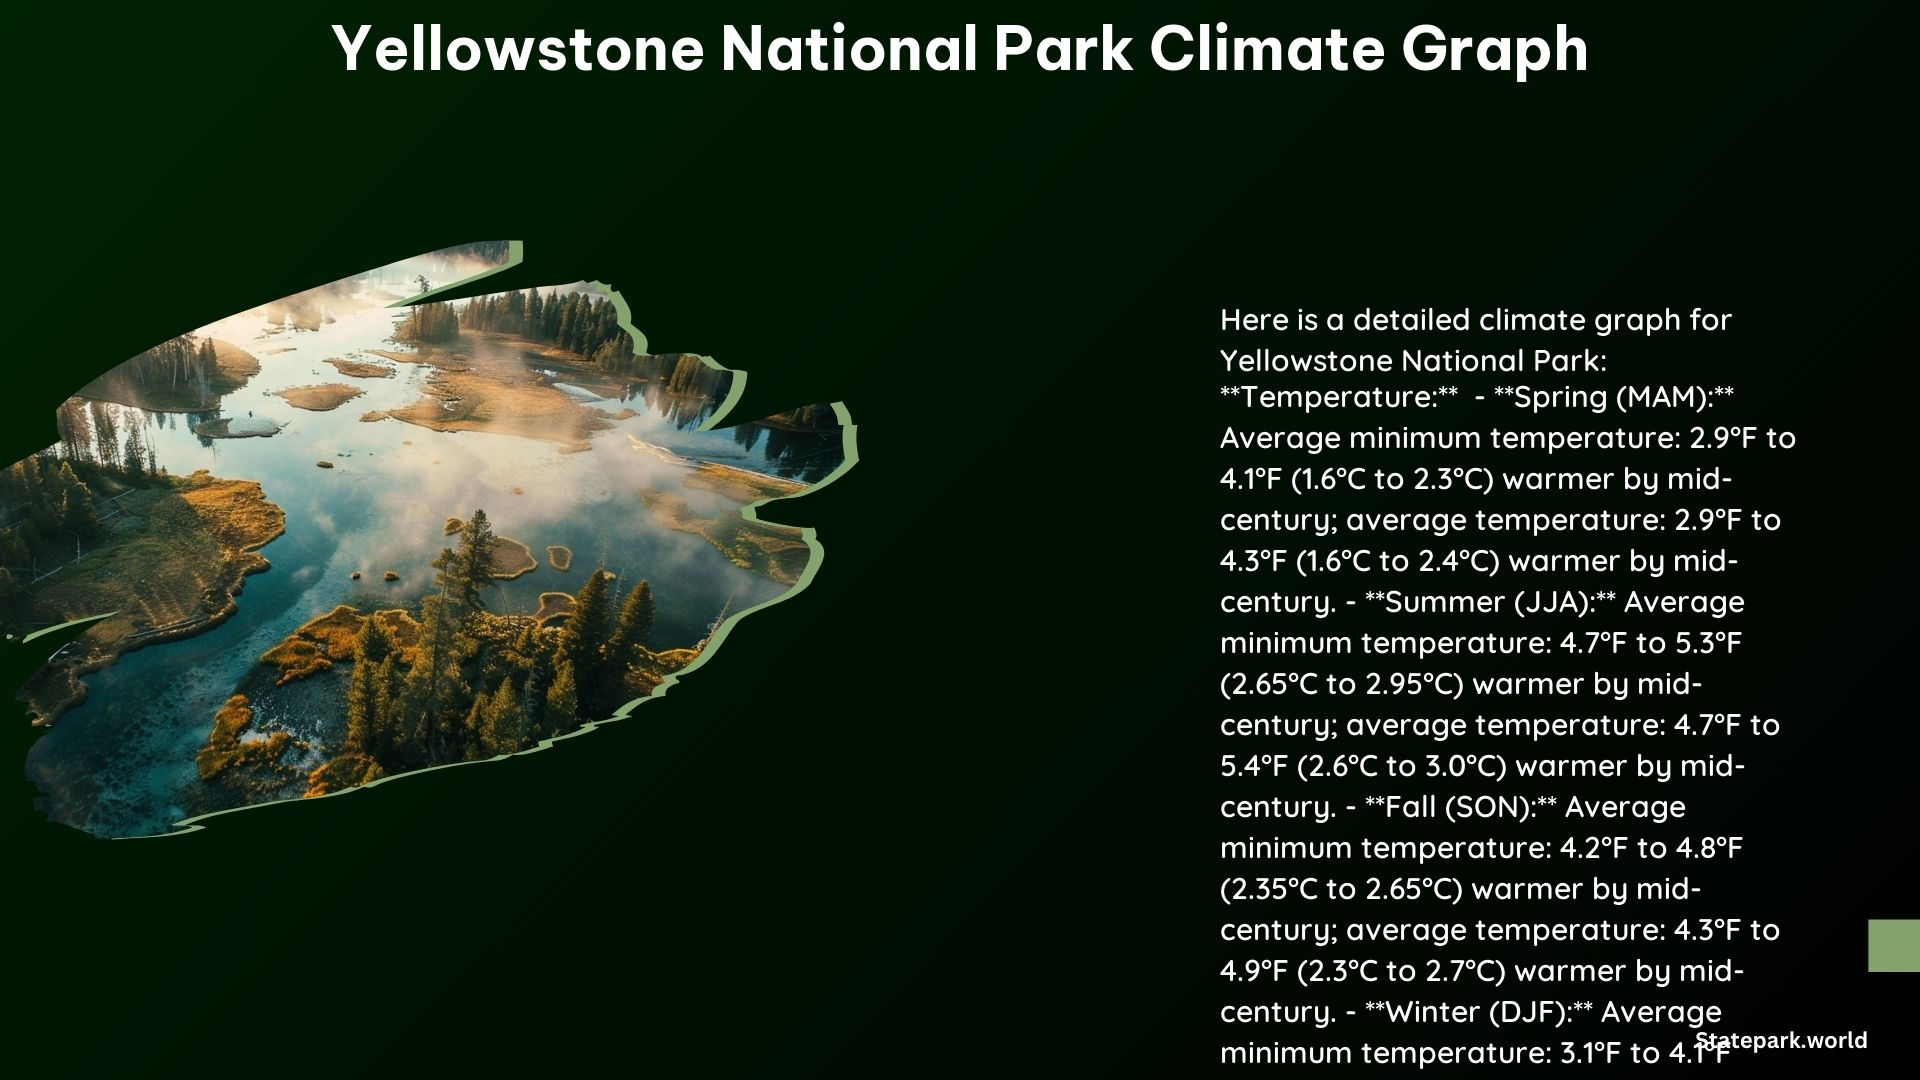
Looking ahead, climate models predict that the warming trend in Yellowstone National Park will continue. By the mid-21st century, the park is expected to see the following temperature changes:
- Spring (March to May): 2.9°F to 4.1°F (1.6°C to 2.3°C) increase
- Summer (June to August): 4.7°F to 5.3°F (2.65°C to 2.95°C) increase
- Autumn (September to November): 4.2°F to 4.8°F (2.35°C to 2.65°C) increase
- Winter (December to February): 3.1°F to 4.1°F (1.7°C to 2.3°C) increase
These projected temperature changes will have far-reaching implications for the park’s ecosystems, potentially leading to shifts in species distribution, changes in the timing of seasonal events, and increased risk of wildfires and other natural disturbances.
Precipitation Patterns in Yellowstone National Park
Annual Precipitation
Yellowstone National Park receives an average of 20.3 inches (51.6 cm) of precipitation annually, which is relatively evenly distributed throughout the year. This precipitation supports the park’s diverse range of habitats, from lush forests to high-altitude alpine meadows.
Monthly Distribution
While the annual precipitation in Yellowstone is relatively consistent, the monthly distribution of rainfall and snowfall can vary significantly. The park typically experiences the highest precipitation levels in spring and early summer, with lower amounts during the drier summer and autumn months.
Seasonal Climate in Yellowstone National Park
Spring (March to May)
During the spring months, Yellowstone’s climate is characterized by daytime temperatures ranging from 30°F to 60°F (0°C to 16°C), with overnight lows often dipping into the teens to single digits (-5°C to -20°C). Snow is a common occurrence during this period, as the park transitions from winter to the warmer summer months.
Summer (June to August)
Summertime in Yellowstone brings more pleasant weather, with daytime temperatures often around 70°F (21°C) and occasionally reaching 80°F (27°C) at lower elevations. Nights can still be cool, and thunderstorms are a common occurrence during the summer months.
Fall (September to November)
As autumn arrives in Yellowstone, the temperatures begin to drop, with daytime highs ranging from 30°F to 60°F (0°C to 16°C) and overnight lows in the teens to single digits (-5°C to -20°C). Snow can start to accumulate during this period, signaling the approach of winter.
Winter (December to February)
Yellowstone’s winters are characterized by cold temperatures, with daytime highs ranging from zero to 20°F (-18°C to -7°C) and sub-zero temperatures common at night and in higher elevations. This is the park’s driest season, with snowfall being the primary form of precipitation.
Additional Climate Information
Cloud Cover
Yellowstone National Park experiences significant variations in cloud cover throughout the year. The clearest month is September, while the cloudiest month is March.
Sunshine
The park also sees significant fluctuations in daylight hours, with the shortest day occurring in December and the longest day in June.
Humidity
The humidity comfort level in Yellowstone National Park is generally moderate, with lower dew points in winter and higher dew points in summer.
Best Time to Visit Yellowstone National Park
According to the tourism score, the best time for warm-weather activities in Yellowstone National Park is from June to September, with the highest tourism score in July.
References
- National Park Service. (n.d.). Yellowstone Climate Explorer. Retrieved from https://www.nps.gov/features/yell/climateexplorer/index.html
- US Climate Data. (n.d.). Wyoming and Weather averages Yellowstone National Park. Retrieved from https://www.usclimatedata.com/climate/yellowstone-national-park/wyoming/united-states/uswy0292
- National Park Service. (2023). Weather – Yellowstone National Park. Retrieved from https://www.nps.gov/yell/planyourvisit/weather.htm
- Climate-Data.org. (n.d.). Yellowstone National Park. Retrieved from https://en.climate-data.org/north-america/united-states-of-america/yellowstone-national-park-10283/
- Weatherspark. (n.d.). Average Weather in Yellowstone National Park, Wyoming, United States, Year Round. Retrieved from https://weatherspark.com/y/150294/Average-Weather-in-Yellowstone-National-Park-Wyoming-United-States-Year-Round.